Friday, April 25, 2014

Highlight unique values in a filtered excel table

Conditional Formatting has some amazing built-in features, for example it lets you highlight unique values in a list without entering a CF formula. If you don´t know how to do this, follow these instructions:
  1. Select your list
  2. Go to "Home" tab on the ribbon.
  3. Click Conditional formatting button
  4. Hover over "Highlight Cells Rules"
  5. Click "Duplicate values..."
  6. Change to "Unique"
    Format cells that contain unique values
  7. Click OK
However, if you then decide to filter the list, the CF rule still highlights unique values as if it is not filtered. The following CF formula highlights unique values in a filtered list.
=SUM(COUNTIF(INDIRECT("Table1[@Description]"), IF(SUBTOTAL(3, OFFSET(INDIRECT("Table1[Description]"), MATCH(ROW(INDIRECT("Table1[Description]")), ROW(INDIRECT("Table1[Description]")))-1,  0, 1)), INDIRECT("Table1[Description]"), "")))=1
You can see in the animated gif below that in the entire list Matsumura Fishworks and QWERTY logistics have duplicate values but in the filtered list Matsumura Fishworks is a unique value and therefor highlighted. That would not be the case if you had used the built-in CF feature.
Highlight unique values in a filtered table5

 How to apply a CF formula rule
You probably use another table name on our worksheet, so make sure you change the name in the CF formula.
  1. Select the table column or list
  2. Go to "Home" tab on the ribbon
  3. Click Conditional formatting button
  4. Click "New rule..."
  5. Click "Use a formula to determine which cells to format"
  6. Paste the above formula in this field.
    format values where this formula is true
  7. Click "Format..." button
  8. Go to tab "Fill"
  9. Pick a background color
  10. Click OK button twice

Monday, April 21, 2014

SUBTOTAL vs SUM excel formula

Excel "SUBTOTAL" formula is one of the exciting excel formulas that you may come across.
The first thing you should know, is that SUBTOTAL doesn't just add up numbers like SUM, it can do eleven different calculations.

Syntax

SUBTOTAL(function_num,ref1,[ref2],...])
SUBTOTAL-Functions-Excel-Formulas
=SUBTOTAL(9,A1:A2) is same as =SUM(A1:A2), however…
SUBTOTALs in SUBTOTAL range are ignored
One of the main issues that excel users face while working with large financial data, is double counting. This occurs when they have to deal with a lot of SUM formulas in a row. SUBTOTAL resolves the issues with ease by ignoring any cells that have subtotals.
SUBTOTAL ignores SUBTOTALs in range - Excel Formulas
Hidden rows can be ignored
One possible limitation of SUM, is that it adds up all of the values within a range, even if you were to hide one or more rows. However, SUBTOTAL gives you the option to add hidden rows (same as SUM formula aka function number 9) or ignore hidden rows (function number 109).
SUBTOTAL can ignore hidden rows - Excel Formulas
SUM of filtered table
If you use SUM to add values in a filtered table, it will add all of the values within the table instead of the filtered values. Again, SUBTOTAL excel formula simplifies things by adding only what has been filtered. It is compatible with both the 9 and 109 function numbers.
SUBTOTAL of filtered table - Excel Formulas
Automatic SUBTOTALs feature
Under the excel "Data" menu, there is a Subtotal button. It is a feature that automatically inserts subtotals within related data. Highlight your table and click on the Subtotal button. You can then specify which group needs subtotalled.

Automatic SUBTOTAL feature - Excel Formulas

Even superheroes have their limitations,
In this case the 109 function is not capable of processing horizontal data. For instance, =SUBTOTAL(109,A1:F1) will add all values in a range, even if any column is hidden.

MS EXCEL: ISERROR FUNCTION


Learn how to use the Excel ISERROR function with syntax and examples.

DESCRIPTION

The Microsoft Excel ISERROR function can be used to check for error values.

SYNTAX

The syntax for the Microsoft Excel ISERROR function is:

ISERROR( value )

PARAMETERS OR ARGUMENTS

value is the value that you want to test. If value is an error value (#N/A, #VALUE!, #REF!, #DIV/0!, #NUM!, #NAME? or #NULL), this function will return TRUE. Otherwise, it will return FALSE.

APPLIES TO

The ISERROR function can be used in the following versions of Microsoft Excel:
  • Excel 2013, Excel 2011 for Mac, Excel 2010, Excel 2007, Excel 2003, Excel XP, Excel 2000

TYPE OF EXCEL FUNCTION

The ISERROR function can be used in Microsoft Excel as the following type of function:
  • Worksheet function (WS)
  • VBA function (VBA)

EXAMPLE (AS WORKSHEET FUNCTION)

Let's look at some Excel ISERROR function examples and explore how you would use the ISERROR function as a worksheet function in Microsoft Excel:


Based on the spreadsheet above, the following Excel ISERROR examples would return:

=ISERROR(A1)would return TRUE
=ISERROR(A2)would return TRUE
=ISERROR(A3)would return TRUE
=ISERROR(A4)would return FALSE
=ISERROR("www.excelconcepts.blogspotblog.com")would return FALSE
=ISERROR(3/0)would return TRUE

EXAMPLE (AS VBA FUNCTION)

The ISERROR function can also be used in VBA code in Microsoft Excel.
Let's look at some Excel ISERROR function examples and explore how you would use the ISERROR function in Excel VBA code:

Dim LReturnValue as Boolean

LReturnValue = IsError(CustomFunction())
In this example, the variable called LReturnValue would now contain whether the call to the CustomFunction resulted in an error.

FREQUENTLY ASKED QUESTIONS

Question: Can you give me specific examples of when and how the ISERROR function is used. Specifically, in a worksheet why would I use this function instead of just running down a column or across a row to look for the errors?
Answer: Often times your spreadsheet contains a large amount of formulas which will not properly calculate when an error is encountered. The ISERROR function, in combination with the If function, can be used to default a cell's value when an error is occurred. This allows your formulas to evaluate properly without your intervention.
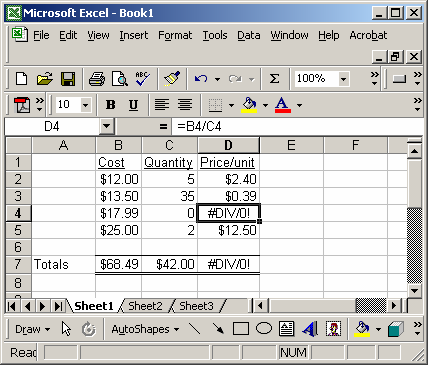
For example, you may encounter a scenario below:

Microsoft Excel

Instead of using the formula:

=B4/C4
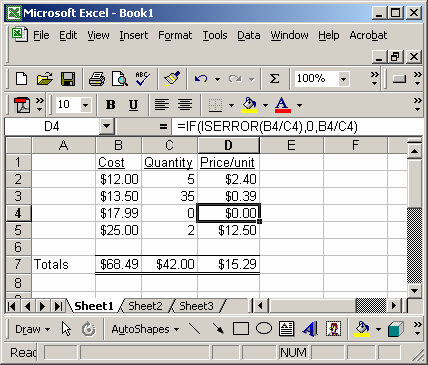
You could use the ISERROR function as follows:

=IF(ISERROR(B4/C4),0,B4/C4)
Microsoft Excel

In this case, the ISERROR function would allow you to return a 0, when an error was encounter such as a "divide by 0 error". Now all of your formulas will still work.

Saturday, April 12, 2014

Data Validation in Excel

Use data validation in Excel to make sure that users enter certain values into a cell.

Data Validation Example


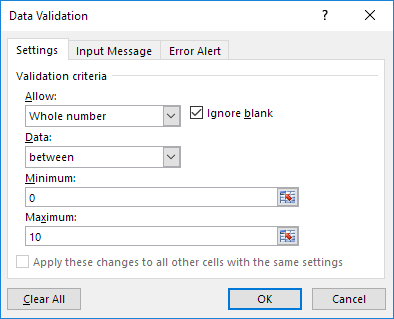
In this example, we restrict users to enter a whole number between 0 and 10.

Excel Data Validation Example


Create Data Validation Rule


To create the data validation rule, execute the following steps.
1. Select cell C2.
2. On the Data tab, click Data Validation.

Click Data Validation

On the Settings tab:
3. In the Allow list, click Whole number.
4. In the Data list, click between.
5. Enter the Minimum and Maximum values.

Validation Criteria

Input Message

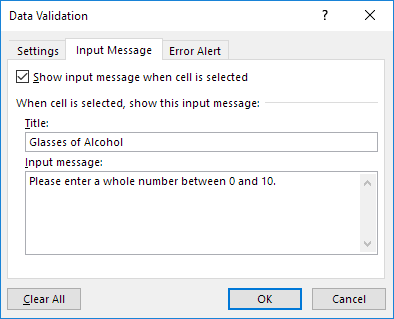
Input messages appear when the user selects the cell and tell the user what to enter.
On the Input Message tab:
1. Check 'Show input message when cell is selected'.
2. Enter a title.
3. Enter an input message.

Enter Input Message


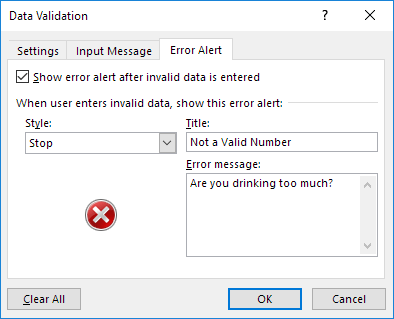
Error Alert

If users ignore the input message and enter a number that is not valid, you can show them an error alert.
On the Error Alert tab:
1. Check 'Show error alert after invalid data is entered'.
2. Enter a title.
3. Enter an error message.
Enter Error Message

4. Click OK.

Data Validation Result

1. Select cell C2.

Input Message

2. Try to enter a number higher than 10.
Result:

Error Alert

Note: to remove data validation from a cell, select the cell, on the Data tab, click Data Validation, and then click Clear All. You can use Excel's Go To Special feature to quickly select all cells with data validation.

Friday, April 11, 2014

Applying Conditional Formatting in Excel

Excel's conditional formatting feature can do a whole lot more than many people realize. Susan Harkins runs through 10 practical ways to put this tool to work. 
Formatting, such as currency, alignment, and color, determines how Excel displays a value. But conditional formatting is more flexible, applying specified formatting only when certain conditions are met. Here are some creative ways you can push conditional formatting beyond its expected uses.
This article assumes a basic knowledge of Excel's conditional formatting feature. In Excel 2007 and 2010, Conditional Formatting is in the Styles group on the Home tab. In Excel 2003, Conditional Formatting is on the Format menu.
1: Distinguish business rule violations
Using conditional formatting, you can visually discern when something is breaking a business rule. For example, Figure A shows a simple timekeeping sheet that highlights a workday that's greater than eight hours. Why? Because your organization requires approval for anything over an eight-hour day.

Figure A

Alert users to overtime hours requiring approval.
Working with the time values complicates things a bit, as you can see in Figure B. This solution uses >.34 to represent time values greater than eight hours, which will work in most cases -- you can't use the value 8 or even the time value 8:00. Or you could use the predefined Greater Than rule in Excel 2007 and 2010, which will automatically use the more accurate value of 0.333333....

Figure B

This formula returns True when a time value is greater than eight hours.

2: Display simple icons

Using conditional formatting (in 2007 and 2010), you can display icons that are often easier to interpret than the values they represent. For instance, a simple checkmark might be quicker to discern than the text value yesontrue, and so on. Figure C shows an icon solution for the same rule violation in #1.

Figure C

Use icons instead of traditional formats to represent conditional rules.
First, select the values in column E and apply one of the default icon sets. Then, use Manage Rules to manipulate the results. Figure D shows the final settings (click Reverse Icon Order first).

Figure D

These settings display green and red icons to alert users to an overtime violation.

3: Highlight a row based on a single value

Filters are great for limiting what you see, but sometimes you want to compare records. When this is the case, conditional formats can distinguish records. Figure E shows a data set of products with a conditional format highlighting only Condiment records.

Figure E

You can distinguish records based on a single value.
Select the entire data range (not the column headings) so Excel can format the entire record (row). Figure F shows the formula-based settings. The $G2 component creates a relative address, which updates with each row: G4, G5, G6, and so on. When the value in the referenced cell equals the string "Condiment," Excel highlights the entire row.

Figure F

You can highlight a row by applying the conditional format to the entire data range instead of a single column.

4: Create a dynamic record highlight

Highlighting an entire record (#3) is convenient, but you might want the conditional format to be more... conditional. For instance, suppose you want users to choose the category on the fly, as shown in Figure G. First, use the Advanced Filter feature to copy a unique list to an out-of-the-way spot, as shown in Figure H. Then, use the Data Validation feature to create a list, also shown in Figure H.

Figure G

Let users choose the highlighted category from a validation list.

Figure H

You'll need a unique list and a validation list.
With the list in place, update the conditional format formula to reference the input list cell, as shown in Figure I. Instead of referencing a cell within the row, the formula references the validation list in B2. Selecting an item from the validation list updates the conditional formatting.

Figure I

This rule references the validation list instead of a literal string value.

5: Compare values

It's common to compare values. For instance, you might track inventory levels by comparing the stock on hand to a reorder level. Using conditional formatting, you can alert users when it's time to reorder, as shown in Figure J. Select the values you want to format -- in this case, that's B2:B46. (You could highlight the entire row or one of the inventory values.) Then, apply the format shown in Figure K.

Figure J

Highlighted items that are running low.

Figure K

This rule highlights the product in column A when the in stock value goes below the reorder level.

6: Compare lists

You can find discrepancies between two lists using a conditional formatting rule, as shown inFigure L. This rule, shown in Figure M, compares each value in column A to its counterpart in column B. If they're not the same, Excel highlights the value in column A. To highlight the values in column B instead, select the values in column B and update the rule formula to reference the values in column A.

Figure L

This rule highlights values in column A when they differ from the values in column B.

Figure M

Apply this rule to compare the two side-by-side lists.

7: Create alternating bands

Many sheets highlight every other row (banding) to improve readability. The Table feature offers several predefined formats that include bands, but you end up with a table instead of a plain data set, and that might not be what you want. When you don't want a table, use conditional formatting to create alternating bands, as shown in Figure N. The rule shown in Figure Ohighlights cells to achieve the alternate band effect.

Figure N

Banding can improve readability, but you'll probably want to highlight even or odd rows and not both, as shown here.

Figure O

Apply either of these rules to create an alternate band effect.

8: Find duplicates

To find duplicate values or records, you can use a filter, but conditional formatting can pinpoint duplicate values on the fly. For instance, the sheet in Figure P shows duplicate values in a single column. Select the values you want to format and apply the formula-based rule shown inFigure Q.

Figure P

Highlight duplicate values for a quick alert.

Figure Q

This rule highlights all occurrences of the same value.
To ignore the first occurrence and highlight only subsequent values, use this formula:
=COUNTIF($A$2:$A2,A2)>1
If you want to check for duplicate values across multiple columns, concatenate the values and apply a similar rule to the results, as shown in Figure R. You can also hide duplicates (which I don't always recommend) by selecting a font color that matches the sheet's background.

Figure R

The concatenating formula in column C finds duplicates across multiple columns.
You can use Excel 2007 and 2010's built-in Find Duplicates rule, but it has a few limitations. First, you don't have much flexibility with the actual formats. Second, this rule selects all duplicate values; you can't choose to ignore the first occurrence and highlight just the subsequent values, as this more flexible formula-based rule can.

9: Find discrepancies

Verifying data is an important task, and Excel's conditional formatting can help by alerting you to inconsistencies. Figure S shows a common accounting tool known as cross-footing -- the process of double-checking totals by comparing subtotals across rows and columns -- in cell F16. Adding the conditional format makes the discrepancy hard to miss when the two totaling values don't match. Select either of the cross-foot formulas and apply the rule shown in Figure T.

Figure S

Combine conditional formatting with cross-footing for a hard-to-miss alert.

Figure T

This rule compares two values.

10: Find the smallest or largest duplicate

It's easy to find the smallest or largest value using the predefined rule shown in Figure U, but you'll need a more complex rule to highlight the smallest or largest duplicate value. As you can see in Figure V, the value 3 is the smallest value in the column, but Excel highlights each occurrence of the value 5.

Figure U

This option finds the smallest or largest value in a range.

Figure V

A more complex rule highlights the smallest or largest duplicate value in a range.
This rule is unstable if you use normal referencing, so apply a range name to your data set before applying the conditional formatting rule. The rule shown in Figure W will highlight the value 3 in the range named List only if 3 is also a duplicate. To find the largest duplicate value, substitute the MIN() function with MAX().

Figure W

This rule ignores the smallest value unless it's also a duplicate value.

Wednesday, April 2, 2014

How to V-LOOKUP

VLOOKUP is an extremely useful tool, and learning how to use it is easier than you think!Before you start, you should understand the basics of functions. Check out our Functions lesson in Excel 2007 (or select a different version of Excel). VLOOKUP works the same in all versions of Excel, and it even works in other spreadsheet applications like Google Spreadsheets.

What exactly is VLOOKUP?

Basically, VLOOKUP lets you search for specific information in your spreadsheet. For example, if you have a list of products with prices, you could search for the price of a specific item.
We’re going to use VLOOKUP to find the price of the Photo frame. You can probably already see that the price is $9.99, but that’s because this is a simple example. Once you learn how to use VLOOKUP, you’ll be able to use it with larger, more complex spreadsheets, and that’s when it will become truly useful.
Screenshot of excel
We’ll add our formula to cell E2, but you can add it to any blank cell. As with any formula, you’ll start with an equal sign (=). Then, type the formula name. Our arguments will need to be in parentheses, so type an open parenthesis. So far, it should look like this:
=VLOOKUP(

Adding the arguments

Now, we’ll add our arguments. The arguments will tell VLOOKUP what to search for and where to search.
The first argument is the name of the item you are searching for, which in this case isPhoto frame. Since the argument is text, we’ll need to put it in double quotes:
=VLOOKUP(“Photo frame”
The second argument is the cell range that contains the data. In this example, our data is in A2:B16. As with any function, you’ll need to use a comma to separate each argument:
=VLOOKUP(“Photo frame”, A2:B16
Note: It’s important to know that VLOOKUP will always search the first column in this range. In this example, it will search column A for “Photo frame”. In some cases, you may need to move the columns around so that the first column contains the correct data.
The third argument is the column index number. It’s simpler than it sounds: The first column in the range is 1, the second column is 2, etc. In this case, we are trying to find the price of the item, and the prices are contained in the second column. That means our third argument will be2:
=VLOOKUP(“Photo frame”, A2:B16, 2
The fourth argument tells VLOOKUP whether to look for approximate matches, and it can be either TRUE or FALSE. If it is TRUE, it will look for approximate matches. Generally, this is only useful if the first column has numerical values that have been sorted. Since we’re only looking for exact matches, the fourth argument should be FALSE. This is our last argument, so go ahead and close the parentheses:
=VLOOKUP(“Photo frame”, A2:B16, 2, FALSE)
And that’s it! When you press enter, it should give you the answer, which is 9.99.
Vlookup First Result

How it works

Let’s take a look at how this formula works. It first searches vertically down the first column (VLOOKUP is short for “vertical lookup”). When it finds “Photo frame”, it moves to the second column to find the price.
Explanation of Vlookup
If we want to find the price of a different item, we can just change the first argument:
=VLOOKUP(“T-shirt”, A2:B16, 2, FALSE)
or:
=VLOOKUP(“Gift basket”, A2:B16, 2, FALSE)

Another example

OK, are you ready for a slightly more complicated example? Let’s say we have a third column that has the category for each item. This time, instead of finding the price, we’ll find the category.
Vlookup Second Example
To find the category, we’ll need to change the second and third arguments in our formula. First, we’ll change the range to A2:C16 so that it includes the third column. Next, we’ll change the column index number to 3, since our categories are in the third column:
=VLOOKUP(“Gift basket”, A2:C16, 3, FALSE)
When you press Enter, you’ll see that the Gift basket is in the Gifts category.
Screenshot of Excel


Now you know the basics of using VLOOKUP. Although advanced users sometimes use VLOOKUP in different ways, you can do a lot with the techniques that we’ve covered. For example, if you have a contact list, you could search for someone’s name to find their phone number. If your contact list has columns for the email address or company name, you could search for those by simply changing the second and third arguments, as we did in our example. The possibilities are endless!

Thursday, March 27, 2014

Excel Pivot Tables

Excel pivot tables are very useful and powerful feature of MS Excel. They can be used to summarize, analyze, explore and present your data.
In plain English, it means, you can take the sales data with columns like salesman, region and product-wise revenues and use pivot tables to quickly find out how products are performing in each region.
In this tutorial, we will learn what is a pivot table and how to make a pivot table using excel.
Excel Pivot Tables: Tutorial

Example uses of Pivot Tables

As I said before pivot tables are very powerful and useful. There are numerous uses of pivot tables that we can talk about them until Christmas.
Here are some example uses of pivot tables:
  • Summarizing data like finding the average sales for each region for each product from a product sales data table.
  • Listing unique values in any column of a table.
  • Creating a pivot report with sub-totals and custom formats
  • Making a dynamic pivot chart
  • Filtering, sorting, drilling-down data in the reports without writing one formula or macro.
  • Transposing data – i.e. moving rows to columns or columns to rows. [learn more]
  • Linking data sources outside excel and be able to make pivot reports out of such data.

Excel Pivot Table Tutorial: How to create your first pivot table

Let us make your first pivot table. We will use example data in the following format.
Pivot Tables in Excel - Tutorial
Step 1:  Select the data
Select the data range from which you want to make the pivot table.
Insert Pivot Table in Excel WorksheetStep 2:  Go to Insert ribbon and click on new Pivot table option
To insert a new pivot table in to your spreadsheet, go to Insert ribbon and click pivot table icon and select pivot table option.
Step 3:  Select the target cell where you want to place the pivot table. For starters, select New worksheet.
Excel will display a pivot table wizard where you can specify the pivot table target location etc. Select “New worksheet” option and your pivot table will be placed in newly created worksheet.
Step 4:  Make your first pivot report
The pivot report UI is very intuitive and sandbox like. To make powerful analysis, all you have to do is drag and drop fields in to the pivot table grid area. In excel 2007, you can also control this by using the “Pivot table panel”.
The pivot report is divided in to header and body sections. You can drag and drop the fields you want in each area. The body itself contains three parts. Rows, Columns and Cells. You can use any fields in these areas too.
For the above sample data, I have set this criteria:
Pivot Table Settings - Row, Column, Header and content settings
And the outcome is this pivot report.
Example Pivot Report - Excel Pivot Tables
It might be a bit difficult to understand how this works. But believe me, if you have seen any reports or worked with any other reporting systems, then the idea of pivot tables, pivot reports and pivot charts becomes quite simple to you.
You can use the excel pivot table features to make a more complicated pivot report like this in no time.
Example Pivot Report - A very detailed Pivot Table with sub-totals and totals

See the Video Tutorial of making Pivot Table in Excel


Some useful tips on Excel Pivot Tables

  • You can apply any formatting to the pivot tables. MS Excel has some very good pivot table formats (and they are better in Excel 2007 and 2010).
  • You can easily change the pivot table summary formulas. Right click on pivot table and select “summarize data by” option.
  • You can also apply conditional formatting on pivot tables although you may want to be a bit careful as pivot tables scale in size depending on the data.
  • Whenever the original data from which pivot tables are constructed, just right click on the pivot table and select “Refresh Data” option.
  • If you want to drill down on a particular summary value, just double click on it. Excel will create a new sheet with the data corresponding to that pivot report value. (This is extremely useful)
  • Making a pivot chart from a pivot table is very simple. Just click on the pivot chart icon from tool bar or Options ribbon area and follow the wizard.